
Demand flexibility to drive demand side management programs
Traditionally, the shape of the electricity load curve remained largely unchanged in India, with only the overall quantum of demand increasing over time. To manage this growing demand, energy efficiency (EE) programs were introduced to slow down the rapid upward shift of the load curve by promoting more efficient energy use.

However, in recent years, the load curve has not only been shifting upwards but also changing in shape due to evolving consumption patterns and the integration of renewable energy sources. RE share in the generation mix is rapidly increasing to meet Renewable Purchase Obligation targets, which in turn limits flexibility on the generation side. Additionally, RE sources are designated as must-run power plants, meaning their generation cannot be curtailed under normal conditions. As a result, distribution licensees must approach demand forecasting differently, considering the net demand—which is the total demand minus RE generation—rather than the absolute demand curve.
This transformation necessitates additional strategies beyond energy efficiency to help electricity distribution companies (Discom) manage demand more effectively. To address this challenge, demand response and demand flexibility concepts have been introduced.
Demand Response (DR) involves actively modulating electricity demand in real time. Consumers either reduce or increase their power consumption based on grid requirements, often in response to price signals or incentives. This helps in balancing supply and demand, especially during peak load periods or when renewable energy availability fluctuates.

Demand Flexibility (DF) Unlike demand response, which directly adjusts the level of consumption, demand flexibility focuses on shifting electricity usage to different time periods without altering the total demand. This means rescheduling energy-intensive activities to off-peak hours, optimizing grid efficiency, and reducing strain during peak times.

Together, energy efficiency, demand response, and demand flexibility create a comprehensive strategy for managing electricity demand, enhancing grid reliability, and supporting the transition to a more sustainable energy future.
Let’s take an example
A standalone small apartment typically includes multiple electrical appliances that contribute to its energy consumption. The table below lists the appliances, their power ratings, and the number of units in use:

These appliances range from essential devices like lights, fans, and refrigerators, which operate throughout the day, to high-power appliances such as air conditioners, washing machines, and water heaters, which are used intermittently but significantly impact peak demand. The energy consumption of the apartment depends on the type, rating, and frequency of appliance usage.
Understanding EE-DR-DF opportunities in residential sector using energy consumption charts
Using the above scenario a few scenarios are presented here, illustrating how potential interventions can improve efficiency, while demand response strategies, and enhancing flexibility in energy consumption can help discoms in demand management.
To illustrate the effects of various energy management strategies, appliances that are turned off as part of an intervention are highlighted in red, indicating a reduction in load during specific time slots. Appliances that have been rescheduled to operate at a different time for better load distribution are marked in green, showing their new time slots. For a better understanding of these interventions, these energy consumption scenarios are illustrated for a 24-hour period:
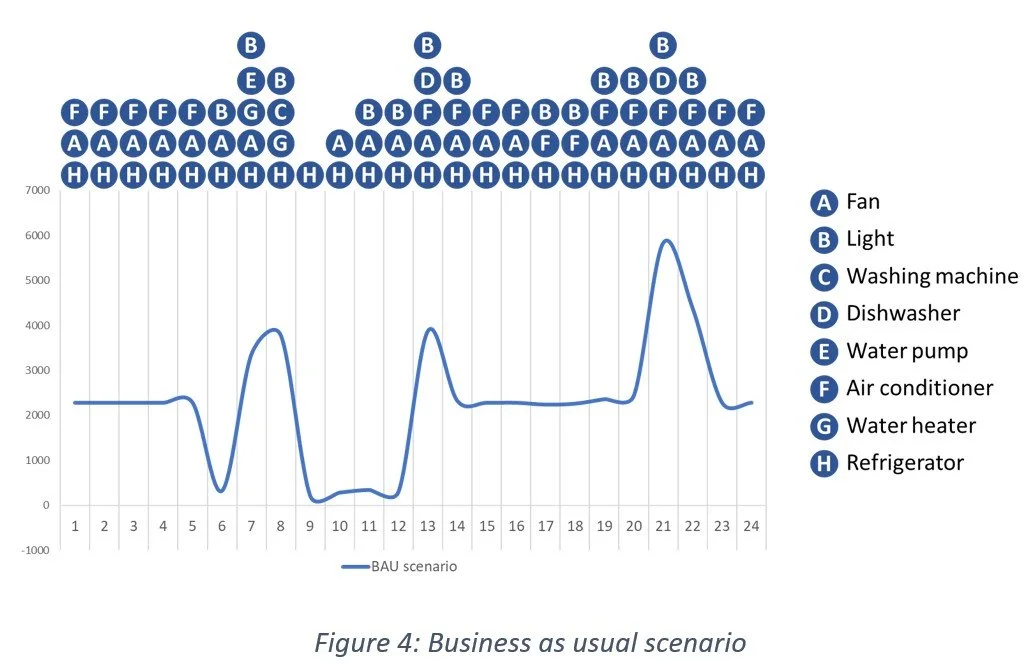
1. Business-as-Usual (BAU) Scenario
To provide a clear representation of each appliance’s contribution to the overall load curve, the status of every appliance—whether it is “switched on” or “switched off”—is depicted using circles labelled with the respective appliance nomenclature. This visual approach helps in understanding how different appliances operate throughout the day and their impact on energy demand. The blue line in Figure-4 represents the BAU scenario, where all appliances function without any optimization or external interventions, reflecting the natural consumption pattern. It shows the windows of peak demand from the residential sector, based on the appliance use.
2. Demand Response scenario
The red circles in the chart represent demand response interventions, where high-power appliances—such as air conditioners—are strategically managed to optimize energy usage during peak hours. This intervention involves:
· Turning off one of the air conditioners or modulating its temperature settings to reduce power consumption without significantly impacting comfort levels.
· Simple behavioural actions, such as limiting the use of multiple rooms simultaneously and turning off unnecessary lights and fans, can help reduce energy consumption effectively.

By implementing these adjustments, demand is shifted away from peak hours, helping to alleviate stress on the grid. The impact of these interventions is reflected in the green line on the chart, which demonstrates a shift in energy consumption patterns compared to the BAU scenario. This shift reduces peak-hour loads, ensuring more balanced electricity usage throughout the day.
3. Demand Flexibility scenario
Demand flexibility refers to the strategic scheduling of appliance usage through automation and smart control strategies, allowing for a more dynamic and efficient energy consumption pattern. Instead of appliances running on fixed schedules, they operate based on real-time grid conditions, ensuring that electricity demand aligns better with supply availability.
In the chart, green circles indicate appliances that have been shifted to different time slots in response to grid conditions. These shifts help in reducing peak demand while ensuring that essential appliances continue to function without compromising comfort. By optimizing appliance operation, demand flexibility minimizes unnecessary energy spikes and promotes a more balanced load distribution. Interventions include:
· Turning on the water heater before peak hours and storing the hot water
· Shifting the water pumping hours to early morning hours to avoid pumping in peak hour
· Operating washing machine and dishwasher in non-peak hours

This approach not only enhances grid stability by preventing excessive strain during high-demand periods but also leads to potential cost savings for consumers by taking advantage of off-peak electricity rates. Over time, such interventions contribute to a more resilient and efficient energy system, benefiting both users and the overall power grid.
Example of a standalone small apartment’s load curve demonstrates how different strategies—such as energy efficiency measures, demand response interventions, and demand flexibility through smart scheduling—can significantly impact electricity consumption patterns. Modulating consumption with minimal impact on comfort allows consumers to reduce electricity bills, while also helping distribution companies lower power purchase costs and maintain grid stability.